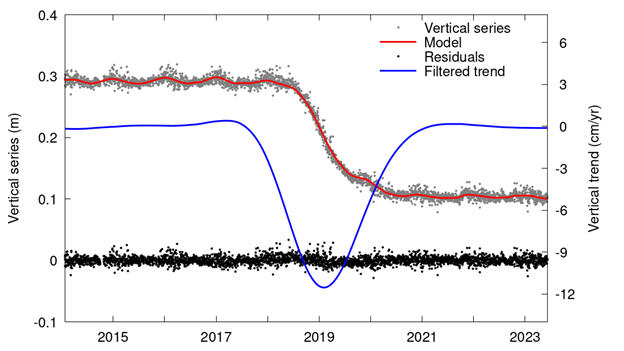
GNSS position time series contain signals that provide information about the deformation of the Earth’s surface, as well as systematic measurement errors, relative to a conventional reference and over different time scales. These scales range from subdaily tidal deformation to interannual loading deformation or secular deformation resulting from tectonic plate motion.
SARI allows users to visualize the series in a web browser, interactively adjust kinematic models, and save and share the results. An exhaustive list of features has been implemented to assist users in extracting the information from the series. This list includes, among others, the estimation of kinematic models with time-varying parameters (Kalman filter), spectral and wavelet analysis, series smoothing (Vondrák filter), and estimation of correlated noise.
Features
The software is designed primarily to process GNSS position time series, but it can be used to process other types of series, even with irregular sampling. For example, it has been used for tide gauge series, loading models, tropospheric delay, GRACE or GNSS-R series.
When using GNSS position time series, several dedicated functionalities are available. These include the ability to directly load series from multiple online servers, select and remove a tectonic plate model, display recorded equipment changes in various metadata formats or in a free format (e.g., earthquake dates). It is also possible to compare and correct a series with a model (e.g., loading, seismic, etc.) or with the series from a nearby GNSS station or a different GNSS solution.
Access
SARI is available on all platforms, except mobile devices:
- Online, with no prerequisites other than an internet connection
- Offline, from a containerized environment
- Offline, by installing the code
The interface includes an information tab with a detailed description of the features and their usage.
Applications

Contact
For more information on SARI and examples, please refer to Santamaría-Gómez (2019) or contact the author Alvaro Santamaría (Géosciences Environnement Toulouse, OMP, alvaro.santamaria-at-get.omp.eu) .

